Key Takeaways
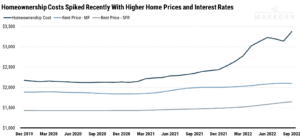
- The National homeownership cost in September 2022 was 1.6x and 2.1x times more expensive than renting an apartment and single family rental, respectively. This was an increase from the 1.1x and 1.3x in February 2020 due to rising home prices and interest rates.
- The spread between rentership and homeownership cost is widening; the theory of mean reversion suggests that rent prices have room to increase and/or home prices/interest rates could trend downward longer-term.
- Of the 127.5 million occupied households in the U.S., 65% are homeowners and 35% are renters. Apartment renters make up 21% and single family renters make up another 12%. All in all, Markerr data covers ~92% of the occupied households in the U.S.
Table of Contents
Overview
There are three main options in getting a roof over your head in the United States: owning a home, renting in a multi-family apartment, or renting a single-family home. Each of these options has a distinct cost associated with it and that delta between options is also variable across markets. With the rapid rise in home prices and interest rates throughout 2022, the cost of homeownership has skyrocketed, making renting a more affordable option for many Americans, albeit being less affordable compared to the longer term history. This report dives deeper into each of the options of shelter cost, compares them to each other at the national level both at the current point in time and through history. Markerr also explores the expensive Western US markets and dives deep into Las Vegas as an example for how the trends can vary across different markets.
Analysis
Markerr data can cover ~118 million occupied households, or ~92% of the total occupied households across the U.S. with representative data. Each of the three major food groups (homeowners, apartment renters, single-family renters) have a monthly ownership cost that can be marked to market.
This chart below shows the breakdown of an average monthly cash outflow for each slice of the housing stock using data as of September 2022:
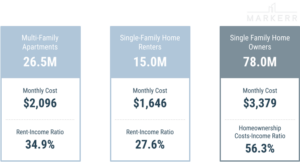
The analysis above, using September 2022 data, shows that homeownership is 1.6x and 2.1x times more expensive than renting an apartment and single family rental, respectively. This was not always the case. In February 2020, the same analysis showed homeownership was only 1.1x and 1.3x times more expensive than renting an apartment and single family rental, respectively. The chart below shows a time series of the U.S. average of shelter cost.
Owning versus Renting Cost across MSAs
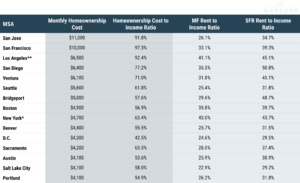
Markerr also explored shelter cost disparity across MSAs. The data showed that markets in the Western US, have larger homeownership premiums. For example, the average home price in Seattle Metro was ~$800,000 in September 2022. This means the monthly average home cost (includes mortgage, property taxes and repair & maintenance numbers) is ~$5,600 versus rent of ~$2,900, which is ~50% less expensive than owning a home on a monthly basis.
For the other rentership option, Markerr’s RealRent Multifamily Rent Index indicates that Seattle’s multifamily rent was $2,300, which is ~60% less expensive than owning a home. This can also be measured using Rent-Income ratio, in which Seattle’s SFR and MFR’s Rent to Income ratios are ~32% and ~25%, respectively. See table below for the same analysis across the top 15 MSAs by homeownership cost.
*Specific to Queens, Bronx, Kings, Westchester, and Nassau counties.
**Excludes Malibu, Beverly Hills, Van Nuys zipcodes.
Note that this analysis only observes the physical cash outflow of shelter cost. It does not account for external benefits to owning a home including, but not limited to, home price appreciation and tax benefits.
Methodology
Markerr approached the affordability question by using the Rent to Income ratio as a proxy. There are a few off-the-shelf datasets that serve as inputs into the equation.
Markerr Datasets Powering the Assumptions:
- Apartment Renters: built from the multi-family subset of Markerr’s RealRent. The data is updated on a monthly basis and comprised of survey rent, listing data, and transaction rents. View the latest example in Markerr’s report on multi-family rent trends in September 2022 across the U.S.
- Single Family Renters: Markerr’s latest product that is from the single-family subset of Markerr’s RealRent. The data is also updated on a monthly basis and is primarily from listing data.
- Homeowners: built from ZHVI home prices, FRED data for monthly interest rates, Markerr Property Dataset information for property taxes, and a 5% assumption for repair and maintenance expenses.
- Household Income: Markerr utilizes nowcasted household income from the Income & Employment Dataset
Markerr used census data to segment the population into homeowners and renters.
Overview: Housing Stock in the U.S.
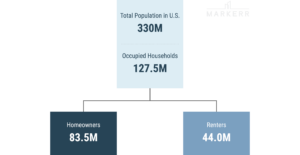
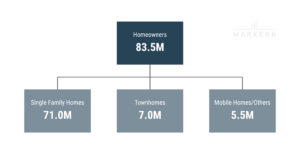
According to the latest Census Bureau’s Population Estimate Program (PEP), there are roughly ~330 million people living in the U.S. Of these 330 million people, there are ~127.5 million households. The homeownership rate in the U.S. is 65.4%, which means that there are ~83.5 million households that own, while ~44 million households rent.
Owner Occupied Households
The 83.5 million owner occupied households are dominated by ~72 million single family homes. This can be further broken down into ~65.5 million single family homes and ~6.5 million townhomes. Mobile homes account for another ~5.5 million owner occupied households.
Renter Occupied Households
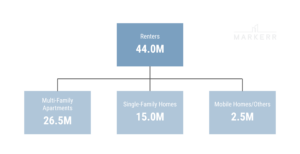
There are 44.0 million rental occupied households. This group tilts slightly more towards apartment rentals, with ~26.5 million households renting apartment units. Another ~15.0 million households rent single family homes, and the remaining ~2.5 million rent mobile homes.
Deep Dive Into Las Vegas
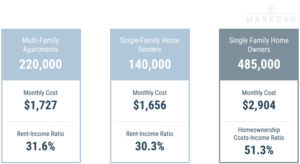
Markerr data estimates Las Vegas to have ~855,000 occupied households, of which ~485,000 occupied households are owner occupied (56.7% homeownership rate) and the remaining ~370,000 are renters. ~220,000 (~60%) are apartment renters and ~140,000 (~40%) are single family renters. Data shows that Las Vegas’ residents are facing a ~70-75% homeownership premium versus renting apartments or single family rental homes.
Conclusion
Affordability is falling across homeownership, and renting both apartments and single family homes. The rising interest rate environment, coupled with high home prices, has made homeownership extremely unaffordable. Markerr data shows that renting in most markets is currently more affordable than owning a home. This likely means that there will be a reversion to the mean of the factors between homeownership costs and rentership costs. This could be seen in a number of factors including: rent prices have continuing to increase or home prices and/or interest rates decreasing. It also means that household income needs to dramatically increase for affordability ratios to fall back into a more normalized range.

