With home prices rising across the US, we took a look at the single-family housing sector to uncover the top-performing markets and notable trends:
Home Prices Achieve Historic Highs with the Most Gains in Austin
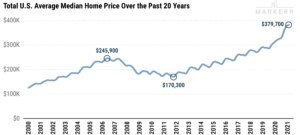
Our Property Data captures historical data from January 2000, by month and MSA. Average median home prices across the top 100 MSAs peaked in August 2006, dipped in 2012 and have steadily grown to the current all-time high median price of ~$380,000 in October 2021.

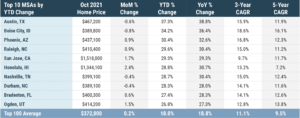
The following chart shows that the best performing markets YTD are Austin, Boise, and Phoenix with an average YoY increase of 34%.

Price Growth Remains Higher than the Historical Norm, But is Modestly Decelerating
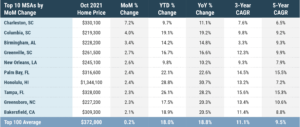
The month-over-month change shows a slowing pace of growth, decelerating from the peak summer months. However, the sequential change is still ~80 bps higher compared to the historical average pace of MoM change. This suggests continued strength in home prices in 2022 and beyond.
The following chart shows that the best performing markets are located primarily in the Carolinas and Florida.

Source: Markerr’s Property dataset is comprised of over 150 million total properties across the U.S., with over 90 million single-family homes represented. We track home prices by looking at the transaction price by date and associated address, to build a time series across MSA.

