We are excited to announce the launch of our Population Dataset, to track population inflows and outflows at the MSA, county, and zip code level. When combined with insights from our RealRent and Income & Employment datasets, Population data gives a clear picture into key demand drivers for single family rental and multifamily assets.
While the Census is ground truth for migration, it is released on a lag of 8+ months, and due to anonymity requirements is only available in a 5-year average at the zip code level. Markerr’s Population data has a 30 day lag, and can be used as a primary or complementary source of migration insights.
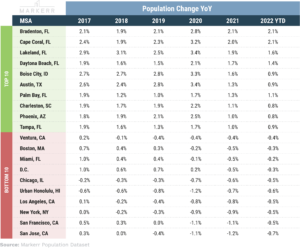
In a recent report, Markerr looked at year-over-year growth rates in 2021 for the Top 100 MSAs and found that six out of the top 10 markets are in Florida. Areas of Boise, Austin, Charleston, and Phoenix round out the top 10 list.
The bottom 10 markets were primarily located on the coasts. More flexible work-from-home policies may have been a big factor in population declines in coastal markets like California as many people were able to move out of the state and keep their jobs.
Notably, Miami and Boston were in the bottom 10 markets. Both cities experienced a decline in population for the first time in over a decade. We attribute these population declines to drops in international immigration due to Covid and large out-domestic migration.
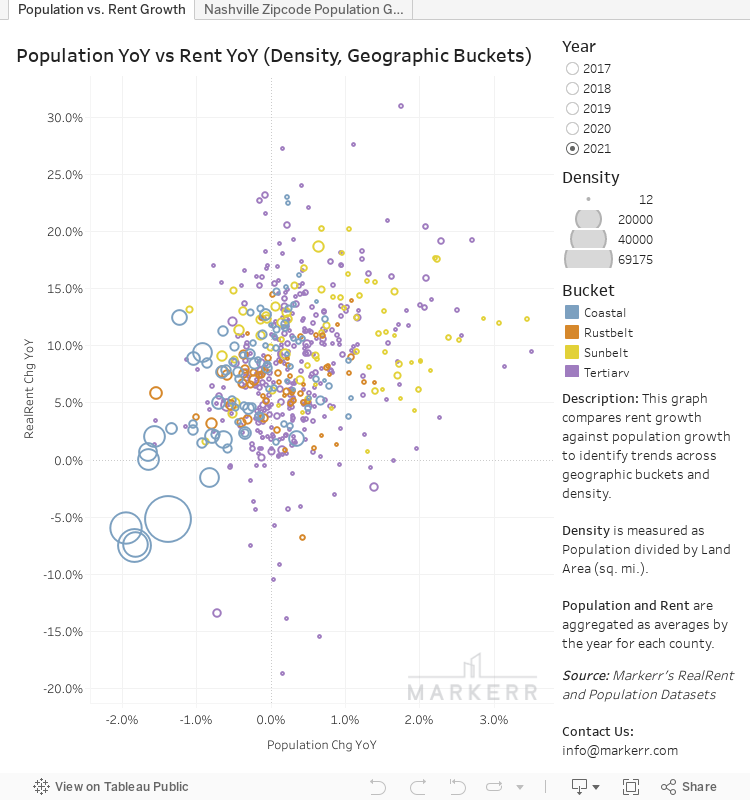
Negative Relationship Between Dense, Coastal Counties and Population & Rent Growth
The densest counties performed the worst on both population growth and rent growth. Large fringe metro (akin to suburbs) saw positive growth during the pandemic, while large central metro (akin to cities) saw slowing growth during the pandemic and negative growth in 2021. It’s also clear that Sunbelt and Tertiary markets performed best on both population growth and rent growth over the past year.
The following interactive chart illustrates the relationship between density, population growth, geographic bucketing, and rent growth and how it changes over time.
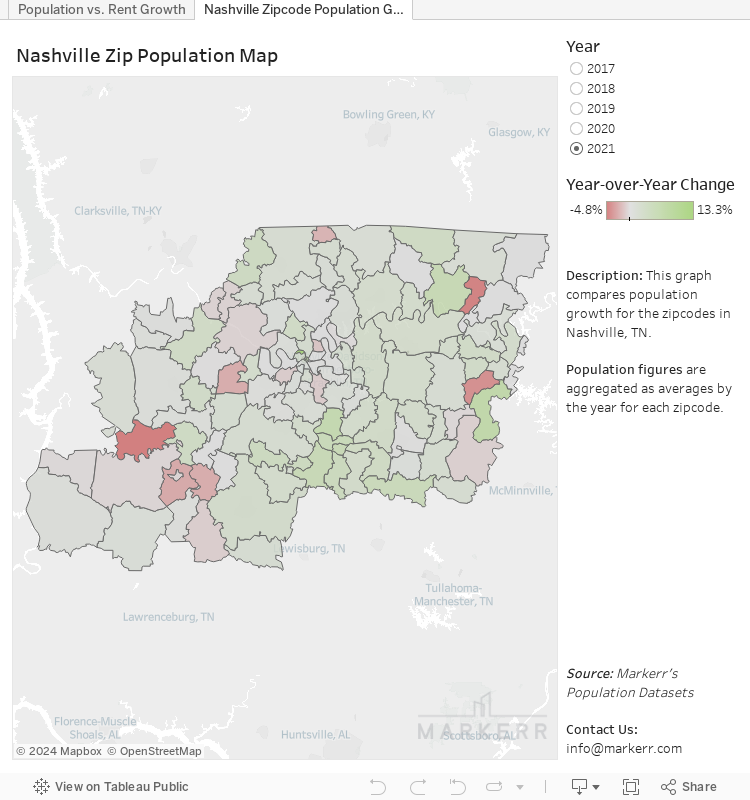
Population Growth by Zip Code in Nashville Points to the Growth in the Southeast
Murfreesboro and the surrounding Southeast area of Nashville have experienced the highest level of population growth over the past five years, as well as during the past two years of Covid.
The following interactive chart illustrates how population growth has been highest in the suburban areas of Nashville. You can see that this is not just a Covid-induced trend, but has been broadly true over the past five years.