
Real estate investors have more data available to them than ever before, but leveraging that data in a meaningful way can be challenging. Markerr’s Guide to Income and Employment shows how this data can be used to make decisions at both the MSA and individual asset level to maximize risk-adjusted returns for multiple strategies.
Our income and employment data carries a notably higher correlation to rent growth than commonly used sources like the Bureau of Labor Statistics (BLS). In fact, Markerr’s employment data has 80 percent stronger correlation to U.S. Census rental data than to BLS.

Moreover, Markerr’s Income & Employment data can be utilized to understand the full history of a market down to block group level. The accuracy, timeliness, and granularity help deliver the best risk-adjusted return for multiple investment strategies. Here are a few use cases:
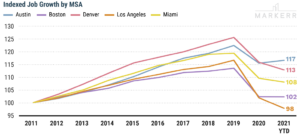
1. Identify Markets with Strong Job Growth: In addition to understanding a real-time figure for employment, this data can be used to compare MSAs against one another to determine what markets are the most attractive.
For example In the chart below, Austin has seen the greatest job growth since 2011.
2. Identify ZIP Codes with Strong Income Growth: At the ZIP code level, investors can calculate income growth CAGRs over a given time period. Nominal income figures also can be examined if the project will be catering to high-earning individuals.
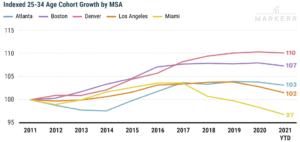
3. Track Growth in Key Demographic Cohorts: Markerr’s data set includes demographics that can be used to track growth in different cohorts by age, educational attainment, and more. This is particularly useful for examining the 25-34 age group, which is monitored closely by residential investors because of their propensity to rent, their critical role in household formation, and their relatively high mobility.
For example, the chart below demonstrates that Denver has shown an increase in the 25-34 age bracket, while Miami has seen a decline over the same period.
While the above examples are the most obvious, there are many more applications for our Income & Employment data. Here are more ways our clients are using this data set to make data-driven decisions.
- Sanity check rent forecasts and market theses during the diligence period with a more real-time view into changes in hiring, employment and income
- Improve the accuracy of rent forecasts by understanding how the market is changing (e.g. more tech worker growth in a ZIP Code will likely lead to higher income growth and therefore likely higher rent growth)
- Other indicators of future rent growth include demographic information like population growth in key renter age cohorts, and the percentage of an area that is college educated
- Examine income and employment changes by density to answer the question of whether to tilt more urban or suburban
- Investor relations teams can use the data to help demonstrate an attractive investment strategy to current or potential investors
- Asset management teams can analyze changing demographics by block group, Census tract, ZIP Code or MSA to get the largest possible increases on new and renewal leases
