With so many people moving to Sunbelt markets, Markerr took a closer look at Austin. While some analysts have found that renters may be priced out of Austin, our forecasts show that rents have likely peaked and there are still opportunities in some pockets of the Austin Metro Area. Here are some of the trends revealed from Markerr’s Deep Dive on Austin.
Rent Trends
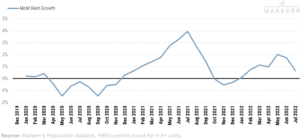
Average rent in Austin is more expensive by up to $642 than other metros in Texas, growing 11.1% over the same period last year and increasing 0.6% over last month. Average rent in July was $2,020, the most expensive across other metros in the state. However, after the rally between late 2020 and 2021, month-over-month data shows some deceleration in rent growth.
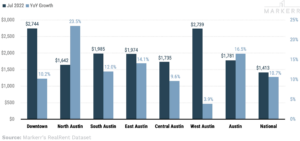
Median rent for 1-bedroom units in Downtown Austin remains the most expensive, with North Austin seeing the largest increase in annual rent growth in July 2022. North Austin led in annual rent growth when compared to other neighborhoods, but also costs less. West Austin is the most costly neighborhood, but only saw 3.9% increase over last year, illustrating a deceleration.
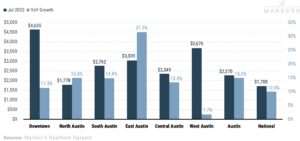
Median rent for 2-bedroom units in Downtown Austin reached an all-time high of $4,635, while East Austin saw the largest increase in annual rent growth.
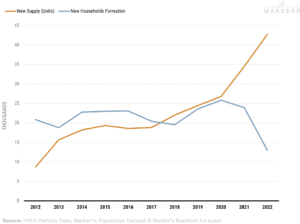
Supply Trends
Austin has been a developer-friendly market over the past decade and has seen a lot of construction activity. Inventory has significantly increased since 2020, but our analysis shows that household formation is lagging. However, Markerr forecast Austin’s annual rent growth to be +6.8% from March 2022 to March 2023, suggesting that Austin’s future rent growth will be positive but not as high as in the last couple of years.
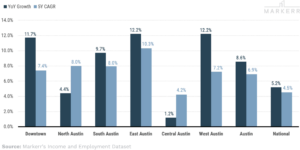
Income Trends
Markerr found that workers living in West Austin have the highest gross income compared to other neighborhoods. West Austin also saw 12.2% income growth, which is higher than the historical 5-Year CAGR of 7.2%. West Austin also saw 12.2% income growth, which is higher than the historical 5-Year CAGR of 7.2% and outperformed the metro area and the nation.
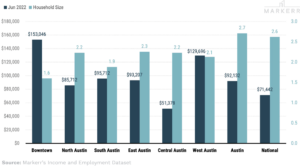
Despite having a smaller household size, households living in Downtown Austin bring home $150,000 annually. West (+12%) and East (+12%) Austin led in household income growth (YoY), outpacing their 5-Year CAGR of 8.6% and 5.6%, respectively.
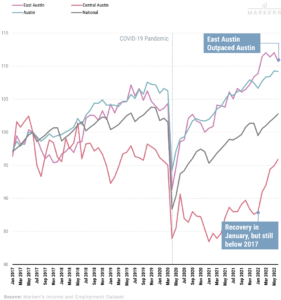
Employment Trends
The number of employees living in East Austin grew the most since 2017. Employment for workers living in Central Austin saw a recovery in the last few months, but remains below 2017 levels.
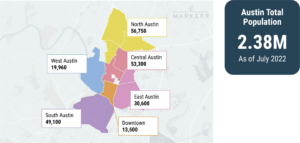
Markerr data shows North Austin has the largest population compared to other neighborhoods in the city. Austin population growth (YoY) fell from 2.3% last year to 1.4% in June 2022. However, Austin’s 5-year CAGR (+2.4%) for population still outperformed the national average (+0.3%).